| 일 | 월 | 화 | 수 | 목 | 금 | 토 |
|---|---|---|---|---|---|---|
| 1 | 2 | 3 | 4 | 5 | 6 | |
| 7 | 8 | 9 | 10 | 11 | 12 | 13 |
| 14 | 15 | 16 | 17 | 18 | 19 | 20 |
| 21 | 22 | 23 | 24 | 25 | 26 | 27 |
| 28 | 29 | 30 | 31 |
- Object detection article
- vlm
- object detection
- google summer of code
- blip-2
- mobilenetv1
- 이미지 필터링
- 엔트로피란
- 원격 학습 안끊기게
- 1차 미분 마스크
- gsoc 후기
- 논문 리뷰
- gsoc 2025
- grefcoco
- clip
- res
- 에지 검출
- Segmentation
- 논문 요약
- gres
- reparameterization
- 딥러닝 목적함수
- grefcoco dataset
- clip adapter
- res paper
- 객체 검출
- gsoc
- 딥러닝 엔트로피
- 기계학습
- referring expression segmentation
- Today
- Total
My Vision, Computer Vision
[논문 리뷰/요약] Noise-contrastive estimation: A new estimation principle forunnormalized statistical models 본문
[논문 리뷰/요약] Noise-contrastive estimation: A new estimation principle forunnormalized statistical models
gyuilLim 2025. 1. 15. 16:43Noise-contrastive estimation: A new estimation principle for unnormalized statistical models
We present a new estimation principle for parameterized statistical models. The idea is to perform nonlinear logistic regression to discriminate between the observed data and some artificially gene...
proceedings.mlr.press
이 논문은 대조 학습(Contrastive learning)의 개념을 수학적으로 설명한 논문이다.
또한 Vision Langauge Model에서 주로 사용되는 InfoNCE Loss의 바탕이 되는 개념을 제시한다.
일반적으로 Softmax와 같은 함수를 사용해 확률 밀도 함수를 정규화하여 모델링하는데,
이 논문은 정규화의 Computational cost를 지적하며 노이즈와 대조하는 방법으로 확률 밀도 함수를 모델링한다.
Abstract
- 매개변수화된 통계 모델(Parameterized statistical model)을 위한 새로운 추정 방법을 제시한다.
- 이 방법은 정규화되지 않은 모델(Unnormalized models)에 적용할 수 있다.
Introduction
- 기본적인 추정 문제는 다음과 같다.
- 랜덤 벡터 $\mathbf x \in \mathbb R^n$ 가 어떤 확률 밀도 함수(Probability dense function) $p_d(.)$ 를 따른다고 할 때, 이 확률 밀도 함수는 매개변수 집합($\alpha$)을 이용하여 $p_m(.;\alpha)$ 로 모델링할 수 있다.
- 즉 특정 파라미터 $\alpha^*$ 에 대해 $p_d(.) = p_m(.;\alpha^)$ 를 만족하는 확률 밀도 함수가 존재하는 것이다.
- 여기서 문제는 목적 함수를 어떻게 최대화해야 $\alpha$ 를 추정할 수 있는지이다.
- 우선 $p_m(.;\alpha)$ 는 확률 밀도 함수이기 때문에, 다음을 만족해야 한다.
$$ \int p_m(\mathbf u; \hat \alpha)d \mathbf u=1 $$
- 확률 밀도 함수이기 때문에, 이 함수의 적분값, 즉 그래프의 넓이는 1이어야 한다는 것이다. 이 때 $p_m(.;\hat \alpha)$ 는 정규화되었다고 할 수 있다.
- 이를 정규화 상수를 도입하여 다시 나타내면 아래와 같다.
$$ p_m(.;\alpha) = \frac{p^0_m(.;\alpha)}{Z(\alpha)}, \quad Z(\alpha)= \int p^0_m(\mathbf u; \alpha)d\mathbf u $$
- $p^0_m(.;\alpha)$ 은 정규화되지 않은 확률 밀도 함수를 의미한다.
- 고차원 데이터의 경우, 데이터의 차원이 매우 크기때문에 적분 공간의 부피가 기하급수적으로 증가하므로 정규화 상수 $Z(\alpha)$ 를 계산하는 문제는 매우 어렵다.
- 정규화 상수를 다루는 가장 간단한 방법은 이를 모델의 추가적인 파라미터로 취급하는 것이다.
- Contrastive divergence나 Score mathcing의 경우 $Z(\alpha)$ 를 근사치로 추정했지만
Noise-contrastive estimation은 입력 데이터 $\mathbf x$ 와 인공적으로 생성된 노이즈 $\mathbf y$ 의 대조 학습으로 $Z(\alpha)$ 를 직접 추정할 수 있다.
Noise-Contrastive Estimation
- 앞에서 $Z(\alpha)$ 를 모델의 추가적인 파라미터로 취급한다고 했는데, 이 말이 무슨 말이냐면
$$ \ln p_m(.;\theta) = \ln p^0_m(.;\alpha) - \ln Z(\alpha) \\ = \ln p_m^0(.;\alpha) +c $$
- 여기서 $\theta = (\alpha, c)$ 이다.
- 확률 밀도 함수에 로그를 씌운 후 $-\ln Z(\alpha)$ 를 임의의 상수 $c$ 로 두고 이를 추정한다는 것이다.
- 즉 $c$ 가 특정 값을 가졌을 때만 $\ln p_m(.;\theta)$ 는 1로 적분될 수 있는 것이다.
- $\alpha$ 와 $c$ 를 추정할 수 있는 목적 함수를 만들기 위해, 분류(Classification) 문제로 접근한다.
- $X = (\mathbf x_1, \cdots, \mathbf x_T)$ 를 입력 데이터 집합, $Y = (\mathbf y1, \cdots, \mathbf y_T)$ 를 노이즈 데이터 집합이라고 하자. 이 때 노이즈는 임의의 분포 $p_n(.)$ 로부터 생성되었다. $\mathbf u= (X, Y)$ 이다.
- 모델이 $X, Y$ 를 구별하기 위해 만들어졌다고 했을 때, 로그 비율로 Classification score를 정의할 수 있다.
$$ G(\mathbf u; \theta) = ln \frac{p_m(\mathbf u;\theta)}{p_n(\mathbf u)} = \ln p_m(\mathbf u; \theta) - \ln p_n(\mathbf u) $$
- 위 수식이 의미하는 Classification Score는 데이터 $\mathbf u$ 가 $p_m(.)$ 에서 나온 데이터(정상)인 경우 증가하고 $p_n(.)$ 에서 나온 데이터(잡음)인 경우 감소한다. 입력 데이터와 노이즈를 잘 구별하게끔 학습하는 것이다.
- 다음으로, 이 점수를 확률로 취급하기 위해 [0, 1] 범위로 변환되도록 Logistic function(sigmoid, $r$)을 사용한다.
$$ h(\mathbf u, \theta) = \frac{1}{1 + exp[-G(\mathbf u; \theta)]} $$
- 따라서 목적함수($J)$를 다음과 같이 정의할 수 있다.
$$ J_T = \frac{1}{2T} \sum_t \ln[h(\mathbf x_t; \theta)] + \ln [1 - h(\mathbf y; \theta)] $$
- 위 목적함수는 총 샘플 개수 $T$ 에 대해, 정상 데이터와 잡음 데이터의 $h$ 값의 평균을 나타낸 것이다.
- 만약 $T$ 의 크기가 충분히 크다면 큰수의 법칙에 의해 $J_T$ 는 다음과 같이 수렴한다.
$$ J(\theta)= \frac{1}{2}E \ln[h(\mathbf x; \theta)] + \ln[1-h(\mathbf y;\theta)] $$
- 이 때, $f(.) = \ln p_m(.;\theta)$ 를 만족하는 어떤 $f$ 가 있다고 하면 아래와 같이 다시 쓸 수 있다.
$$ J(f) = \frac{1}{2}E \ln [r((f(\mathbf x) - \ln p_n(\mathbf x))] + \ln[1-r(f(\mathbf y) - \ln p_n(\mathbf y))] $$
- 즉 데이터, 잡음 쌍 $(\mathbf x, \mathbf y)$ 가 주어졌을 때, 노이즈 데이터($\mathbf y$)가 만들어진 분포($p_n(.)$)만 미리 안다면, 위와 같이 계산하여 로그 확률 밀도 함수 $\ln p_m(.;\theta) = \ln p_m^0(.;\alpha) +c$ 를 학습할 수 있게 되는 것이다.
Data Generation
Noise data($\mathbf y$)
- 목적 함수를 계산하기 위해 노이즈 데이터에 대한 분포( $p_n(.)$)는 미리 알고있어야 하므로, 가우시안 분포나 간단한 확률 분포를 사용한다.
Input data($\mathbf x)$
- 입력 데이터 $\mathbf x \in \mathbb R^4$ 는 ICA(Independent Component Analysis) 모델을 통해 계산된다.
$$ \mathbf x = A \mathbf s $$
- $A = (\mathbf a_1, \cdots, \mathbf a_4)$ 이고, $\mathbf s$ 는 라플라스 분포를 따른다.
구현(Implementation)
1. 데이터 생성
# ICA 모델을 이용한 입력 데이터(x) 생성
def generate_ica_data(batch_size, input_dim):
    A = torch.randn(input_dim, input_dim)
    laplace_dist = Laplace(torch.zeros(input_dim), torch.ones(input_dim))
    s = laplace_dist.sample((batch_size,))
    data = s @ A.T
    return data

# 학습 환경
data_size = 1000
input_dim = 4
num_epochs = 40
learning_rate = 0.005

# Train data, Test data 각각 생성
train_data_samples = generate_ica_data(data_size, input_dim)
test_data_samples = generate_ica_data(data_size, input_dim)

# 가우시안 분포로부터 노이즈 데이터(y) 생성
noise_samples = torch.randn(batch_size, input_dim)
2. 데이터 분포 비교
$$J(f) = \frac{1}{2}E \ln [r((f(\mathbf x) - \ln p_n(\mathbf x))] + \ln[1-r(f(\mathbf y) - \ln p_n(\mathbf y))]$$
- 아래 코드는 위 식에서 $\ln p_n(.)$ 을 계산하는 과정이다.
- 노이즈 데이터가 가우시안 분포로부터 만들어졌기 때문에, $\mathbf x, \mathbf y$ 각각에 대한 확률값 $p_n(\mathbf x), p_n(\mathbf y)$ 을 계산한 후 로그를 씌운다.
def compute_log_noise_probs(samples, mean=0.0, std=1.0):
    var = std ** 2
    log_probs = -0.5 * (torch.log(torch.tensor(2 * torch.pi * var)) + (samples - mean)**2 / var)
    return log_probs.sum(dim=1)

# 입력 데이터와 노이즈 데이터를 concat 한 후 계산
log_noise_probs = compute_log_noise_probs(torch.cat([train_data_samples, noise_samples]))- 위 코드로부터 만들어진 log prob를 시각화해보면 아래와 같이 왼쪽(입력 데이터)는 낮은 값을, 오른쪽(노이즈 데이터)는 높은 값을 가지고 있는 것을 확인할 수 있다.

- 즉 ICA 모델로부터 만들어진 입력 데이터는 노이즈 데이터가 만들어진 가우시안 분포에 속할 확률이 낮다는 것이다.

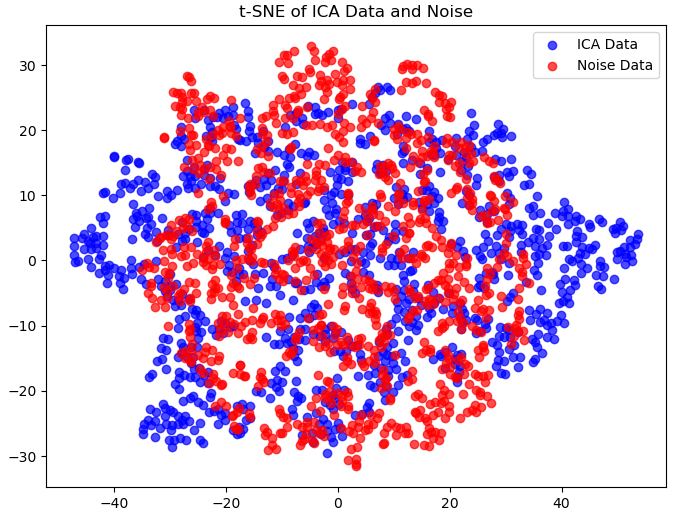
- t-SNE를 통해 생성된 입력 데이터와 노이즈 데이터를 시각화해보면 위와 같다.
3. 모델 정의
# 간단한 Fully connected layer 정의
class SimpleModel(nn.Module):
    def __init__(self, input_dim):
        super(SimpleModel, self).__init__()
        self.fc1 = nn.Linear(input_dim, 36)
        self.fc2 = nn.Linear(36, 64)
        self.fc3 = nn.Linear(64, 1)

    def forward(self, x):
        x = self.fc1(x)
        x = self.fc2(x)
        x = self.fc3(x)
        return x.squeeze()

# 모델 및 옵티마이저 초기화
model = SimpleModel(input_dim)
optimizer = optim.Adam(model.parameters(), lr=learning_rate)
4. NCE Loss Function
$$ J(f) = \frac{1}{2}E \ln [r((f(\mathbf x) - \ln p_n(\mathbf x))] + \ln[1-r(f(\mathbf y) - \ln p_n(\mathbf y))] $$
- 이제 목적함수를 계산할 수 있다.
# NCE 목적 함수
def nce_loss(f_x, f_y, log_noise_probs):
    term1 = torch.log(sigmoid(f_x - log_noise_probs[:len(f_x)])).mean()
    term2 = torch.log(1 - sigmoid(f_y - log_noise_probs[len(f_x):])).mean()
    loss = -0.5 * (term1 + term2)
    return loss
- $f(\mathbf x)$ 와 $f(\mathbf y)$ 는 모델의 출력을 의미한다.
5. 학습
loss_list = []

# 학습 루프
for epoch in range(num_epochs):
    optimizer.zero_grad()

    # 입력 데이터, 노이즈 데이터 각각에 대한 모델 전방 계산
    f_x = model(train_data_samples)
    f_y = model(noise_samples)

    # NCE Loss 계산
    loss = nce_loss(f_x, f_y, log_noise_probs)

    # 학습
    loss.backward()
    optimizer.step()

		# Loss 저장
    loss_list.append(loss.item())

# Loss 시각화
plt.plot(loss_list)
- 아래 Loss curve를 보면 알 수 있듯이, 학습이 잘 된다.

6. 결과 비교
# 모델 Test
model.eval()
with torch.no_grad():
		# Test data에 대한 모델 출력값 계산
    f_test_x = model(test_data_samples)

    # Noise sample은 훈련 시 사용한 것과 같음
    f_test_y = model(noise_samples)

    # NCE Loss 계산
    test_log_noise_probs = compute_log_noise_probs(torch.cat([test_data_samples, noise_samples]))
    test_loss = nce_loss(f_test_x, f_test_y, test_log_noise_probs)

# Nce Loss 값 출력
print(f"Test Loss: {test_loss.item():.4f}")

# 예측 결과 시각화
plt.figure(figsize=(12, 6))
plt.subplot(1, 2, 1)
sns.kdeplot(test_data_samples.numpy().flatten(), label="True ICA Data", color='blue', fill=True)
sns.kdeplot(f_test_x.numpy().flatten(), label="Prediction of ICA data, f(x)", color='red', fill=True)
sns.kdeplot(f_test_y.numpy().flatten(), label="Prediction of Noise data, f(y)", color='black', fill=True)
plt.xlabel('Value')
plt.ylabel('Density')
plt.legend()
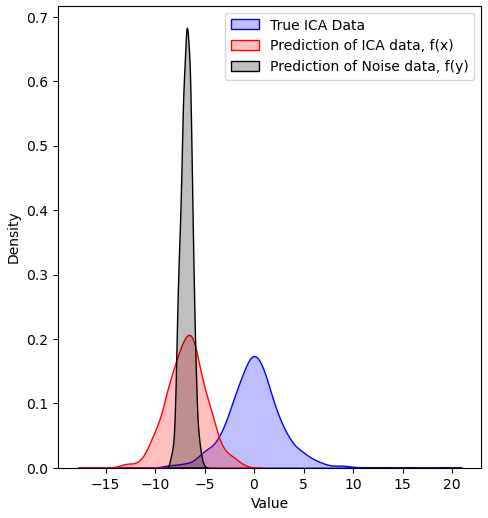
- 아래 그래프에는 세 가지 분포가 있는데, 다음과 같다.
- True ICA data에 대한 분포(파란색)
- ICA data에 대한 예측 분포(빨간색)
- Noise data에 대한 예측 분포(검은색)

- 결론은 노이즈 분포에 비해 입력 데이터의 분포가 원래 분포와 더 유사하게 생성하게 되었다는 것을 확인함으로써, Noise-Contrastive Estimation의 효과를 입증할 수 있다는 것이다.


